 Premier League
 Champions League
 LaLiga
 Serie A
 Bundesliga
 Ligue 1
 National teams
 MLB
 CPBL
 NPB
 KBO League
 Taiwanese players abroad
 League of Legends
 VALORANT
 CS2
 Dota 2
Baseball stats explained: AVG, OBP, SLG, OPS, ERA, WHIP, FIP and WARGuides · Baseball · Stats explained

Key points
- One hitter and one pitcher provide consistent worked examples
- Eight essential metrics, their formulas and meaningful benchmarks
- Before judging a hot month, check the sample size
1Meet our sample hitter
We will use one fictional hitter, Ming, throughout the batting examples:
| Item | Abbreviation | Value |
|---|---|---|
| Plate appearances | PA | 600 |
| At-bats | AB | 520 |
| Hits | H | 150 |
| Singles | 1B | 95 |
| Doubles | 2B | 30 |
| Triples | 3B | 3 |
| Home runs | HR | 22 |
| Walks | BB | 65 |
| Hit by pitch | HBP | 7 |
| Sacrifice flies | SF | 6 |
| Sacrifice bunts | SH | 2 |
A plate appearance counts every completed trip to the box; an at-bat excludes walks, hit-by-pitches and sacrifices. From Ming's 600 PA, subtract 65 + 7 + 6 + 2 = 80 to reach 520 AB.
2Batting average and on-base percentage: AVG and OBP
These are baseball's basic hit and reach-base measures.
AVG: the old standard that ignores walks
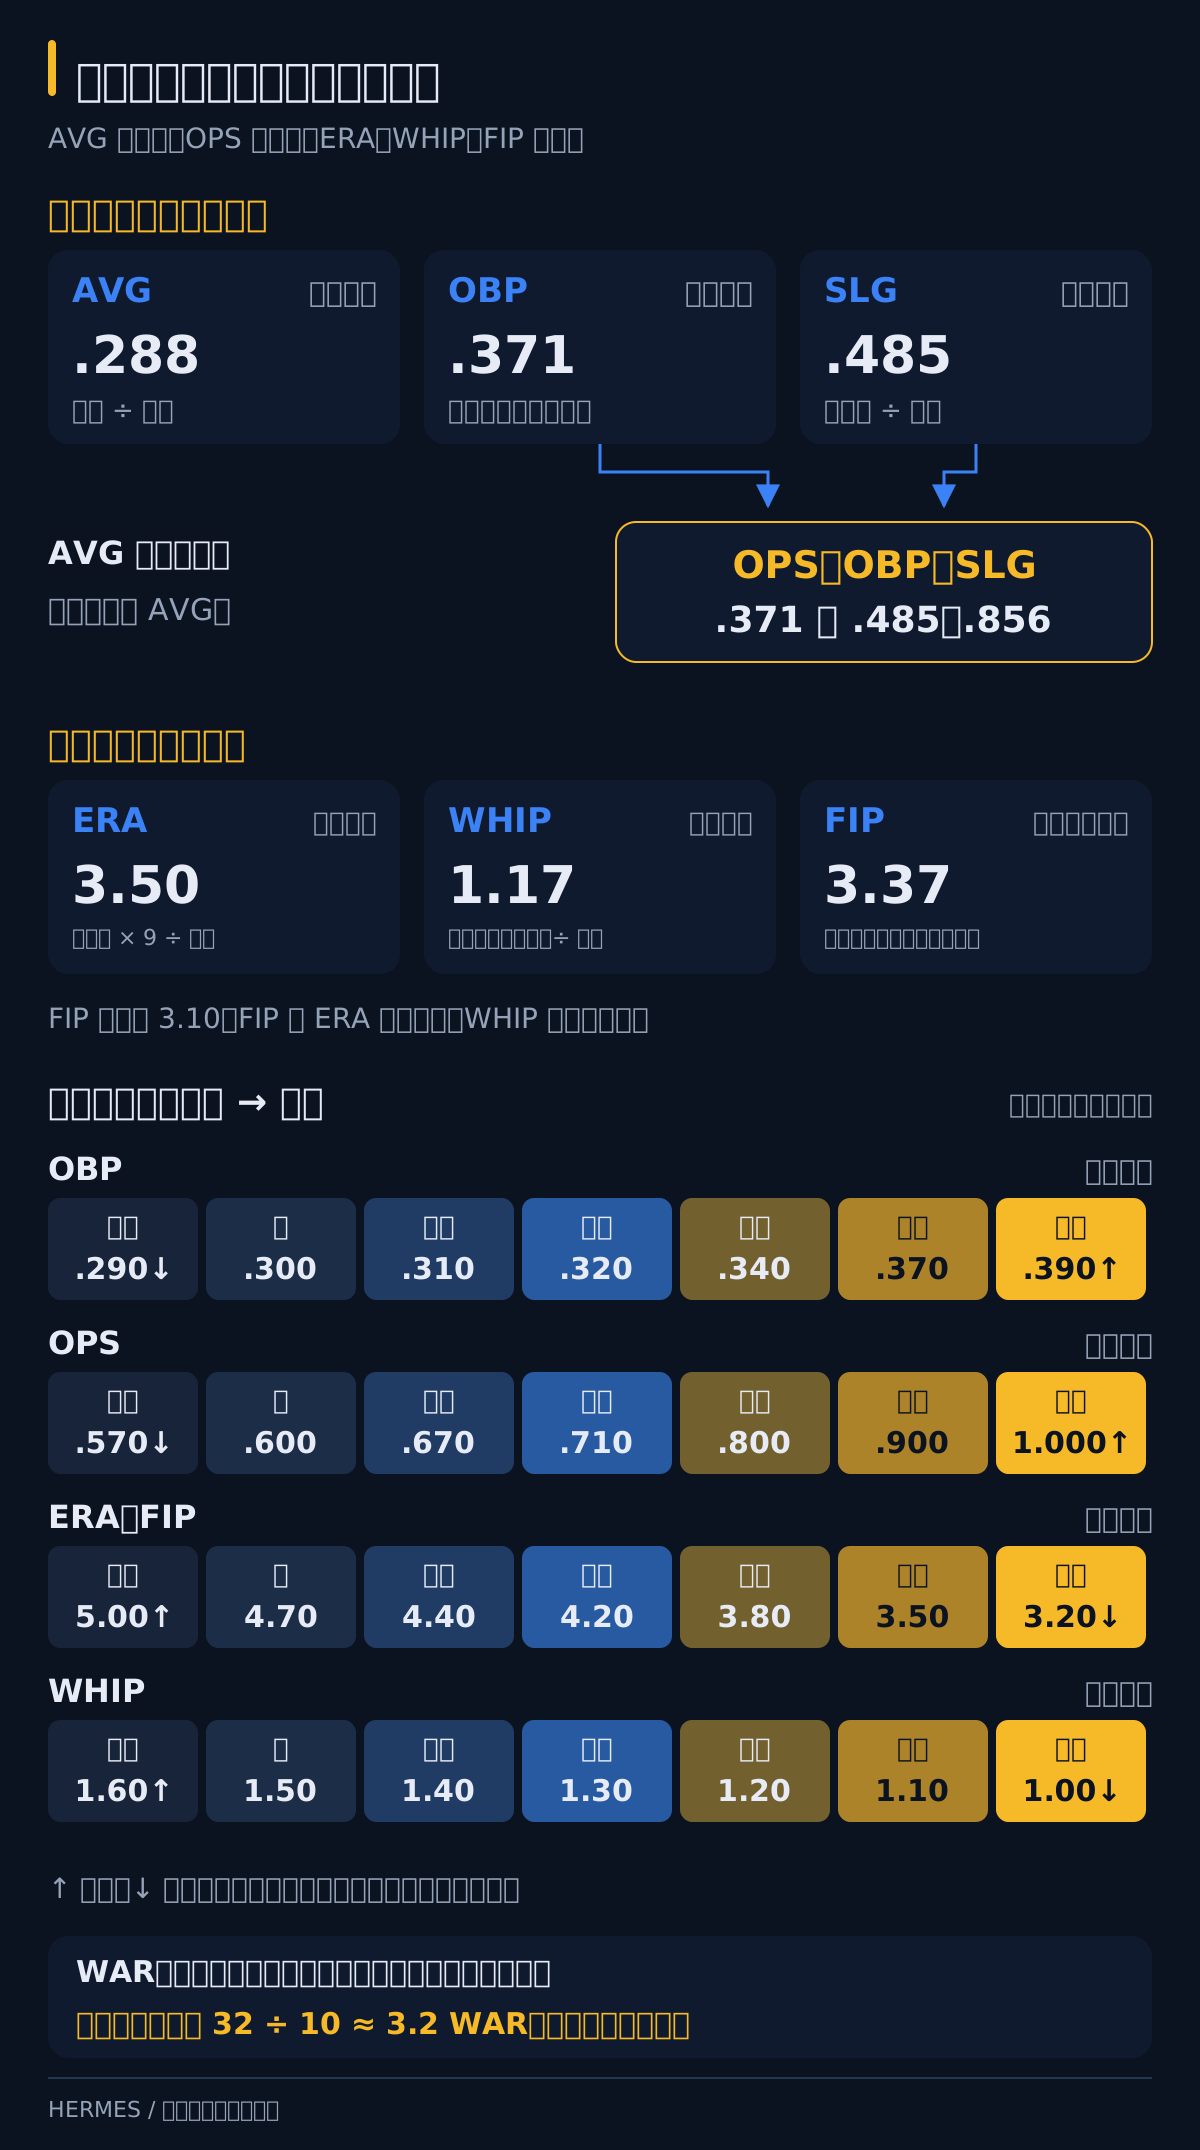
AVG = hits ÷ at-bats
For Ming: 150 ÷ 520 = .288. Baseball convention drops the leading 0.
AVG's central weakness is that walks disappear. Two .280 hitters can draw 20 and 90 walks respectively—a difference of 70 trips to base—with identical averages. MLB hit .244 overall in 2026, so .300 was already excellent.
OBP: the skill of avoiding outs
OBP = (hits + walks + HBP) ÷ (at-bats + walks + HBP + sacrifice flies)
Ming: (150 + 65 + 7) ÷ (520 + 65 + 7 + 6) = 222 ÷ 598 = .371.
OBP is normally about seven points above AVG; the 2026 MLB marks were .318 and .244, a .074 gap. Ming's larger gap reflects his walks. The Moneyball-era Oakland Athletics famously exploited an undervalued market for that skill in the early 2000s.
| Level | OBP |
|---|---|
| Elite | .390+ |
| Excellent | .370 |
| Above average | .340 |
| Average | .320 |
| Below average | .310 |
| Poor | .300 |
| Very poor | .290 or lower |
These FanGraphs benchmarks put Ming's .371 at “excellent”; the 2026 league average was .318.
3Slugging and OPS: SLG and OPS
OBP asks whether a hitter reaches. SLG asks how many bases the hits produce. OPS combines them.
SLG: total bases per at-bat
SLG = total bases ÷ at-bats
A single is worth 1, double 2, triple 3 and homer 4.
Ming's total bases: 95 × 1 + 30 × 2 + 3 × 3 + 22 × 4 = 95 + 60 + 9 + 88 = 252.
SLG: 252 ÷ 520 = .485. Despite its name, SLG is an average and can theoretically reach 4.000.
| Hitter | Hits in 520 AB | Total bases | AVG | SLG |
|---|---|---|---|---|
| Ming | 150, including 22 HR | 252 | .288 | .485 |
| Singles hitter | 150, all singles | 150 | .288 | .288 |
OPS: reach base plus power
OPS = OBP + SLG
Ming: .371 + .485 = .856.
| Level | OPS |
|---|---|
| Elite | 1.000+ |
| Excellent | .900 |
| Above average | .800 |
| Average | .710 |
| Below average | .670 |
| Poor | .600 |
| Very poor | .570 or lower |
MLB's 2026 slash line was .244/.318/.400, producing roughly .719 OPS from unrounded components. Ming's .856 is a middle-order mark; 1.000 belongs to the game's very best.
OPS's small flaw
OPS weights OBP and SLG equally, although, according to the FanGraphs Library, reaching base is worth roughly 1.8 times as much as slugging in run creation (estimates vary slightly between studies). It can flatter power-only hitters. OPS+ is more refined: 100 is league average and 120 is 20% better, adjusted for park and season.
4ERA: earned runs per 9 innings
Our sample pitcher, Qiang:
| Item | Abbreviation | Value |
|---|---|---|
| Innings | IP | 180 |
| Earned runs | ER | 70 |
| Hits | H | 160 |
| Walks | BB | 50 |
| Hit by pitch | HBP | 6 |
| Strikeouts | K | 190 |
| Home runs | HR | 20 |
ERA = earned runs × 9 ÷ innings pitched
Qiang: 70 × 9 ÷ 180 = 3.50, or 3.5 earned runs per 9 innings. Runs attributable to fielding errors are not earned.
Innings decimals are not base 10
A line of 6.2 IP means 6 and 2/3 innings, not 6.2. Allowing 2 earned runs in 6.2 IP gives 2 × 9 ÷ 6.667 = 2.70. Dividing by 6.2 would incorrectly produce 2.90.
ERA benchmarks
| Level | ERA/FIP |
|---|---|
| Elite | 3.20 or lower |
| Excellent | 3.50 |
| Above average | 3.80 |
| Average | 4.20 |
| Below average | 4.40 |
| Poor | 4.70 |
| Very poor | 5.00+ |
MLB's 2026 ERA was about 4.2. Relievers normally run lower figures, so this table is primarily for starters. Qiang's 3.50 is excellent.
5WHIP and FIP: two more pitching lenses
ERA records outcomes; WHIP measures traffic; FIP strips away much of defence and sequencing.
WHIP: baserunners allowed per inning
WHIP = (walks + hits) ÷ innings pitched
Qiang: (50 + 160) ÷ 180 = 1.17.
| Level | WHIP |
|---|---|
| Elite | 1.00 or lower |
| Excellent | 1.10 |
| Above average | 1.20 |
| Average | 1.30 |
| Below average | 1.40 |
| Poor | 1.50 |
| Very poor | 1.60+ |
The 2026 MLB average was about 1.30. WHIP omits HBP and counts a homer exactly like a single, so it cannot describe every baserunner's damage.
FIP: outcomes the pitcher controls
FIP = (13 × HR + 3 × (BB + HBP) − 2 × K) ÷ IP + constant
The annual constant, around 3.1, aligns league-average FIP with league-average ERA. For Qiang, using 3.10:
- 13 × 20 = 260
- 3 × (50 + 6) = 168
- 2 × 190 = 380
- 260 + 168 − 380 = 48
- 48 ÷ 180 = 0.27; + 3.10 = 3.37
Why FIP exists
Once contact enters play, defence and fortune influence whether it becomes a hit. FIP isolates strikeouts, walks, HBP and homers. Sequencing matters too. With two outs, the same single, single, homer and out can allow 3 runs if the homer comes third, but only 1 if it comes first—a 2-run ERA swing from identical events. FIP treats both alike.
When ERA and FIP diverge
| Pitcher | ERA | FIP | Reading |
|---|---|---|---|
| A | 2.90 | 4.10 | Defence or fortune may be suppressing ERA |
| B | 4.60 | 3.40 | Results may improve |
| Qiang | 3.50 | 3.37 | Results and underlying work agree |
FIP usually predicts a pitcher's future ERA better than ERA itself.
6WAR: wins above a replacement player
WAR converts hitting, baserunning, fielding—or pitching—into wins. It asks how many wins a club would lose by replacing the player with readily available minor-league talent.
Replacement level is set around a .294 winning percentage: an entire replacement roster would win about 48 of 162 games.
For a position player:
WAR = (batting + baserunning + fielding + position + league + replacement runs) ÷ runs per win
One win is roughly 10 runs, though the exact figure varies slightly with each season's run environment. A sample estimate for Ming (the component run values below are illustrative figures chosen to show how the pieces fit together, not numbers derived from his .856 OPS):
| Component | Runs |
|---|---|
| Batting | +25 |
| Baserunning | +2 |
| Fielding | -3 |
| First-base positional adjustment | -12 |
| Replacement runs over 600 PA | +20 |
| Total | +32 |
32 ÷ 10 ≈ 3.2 WAR. First base carries a penalty because it is less demanding than shortstop or catcher.
| Level | WAR (position player or starter) |
|---|---|
| Replacement | 0–1 |
| Role player | 1–2 |
| Regular | 2–3 |
| Good | 3–4 |
| All-Star | 4–5 |
| Superstar | 5–6 |
| MVP level | 6+ |
A typical regular is around 2 WAR; Ming's 3.2 is good.
fWAR and bWAR
FanGraphs fWAR evaluates pitchers through FIP; Baseball-Reference bWAR uses actual runs allowed. Values can differ, so compare players within one source.
7Which stat best reflects ability?
| Question | Start with | Why |
|---|---|---|
| Overall offence | OPS, OPS+ | Includes reaching and power |
| Plate discipline | OBP minus AVG | Wider gap usually means more walks |
| Pitching skill | FIP, strikeouts, walks | Reduces defence and luck |
| Actual runs allowed | ERA | Direct result |
| Total player value | WAR | Combines offence, defence and running |
Sample size comes next. A good hitter can post a .500 OPS over the first 50 PA. OBP needs roughly 500 PA before it begins to represent a player's established ability. Always check opportunities before judging a month.
At team level, Pythagorean expectation asks how much of a record is luck; try the calculator. Current records are on the MLB page, and the postseason guide explains October.
8FAQ
How good is a .900 OPS?
Very good. MLB averaged around .719 in 2026; .900 is an impact bat, while 1.000 is elite.
ERA and FIP disagree. Which should I trust?
ERA answers what happened; FIP better isolates how the pitcher performed and what may happen next. A gap larger than 1 often signals defence or luck.
Can WAR be negative?
Yes. Negative WAR says a readily available replacement would probably help more.
Where can I look up basic baseball terms?
The glossary explains batting average, on-base percentage, ERA and more.
9Sources

A-Ji
A-Ji covers MLB, NPB and baseball data across leagues. He considers plate appearances, pitcher usage, fielding position and schedule context together rather than leaning on a single statistic, with a focus on format differences, useful metrics and overseas players followed in Taiwan.
View profile and articles ›